


B2B SaaS conversion benchmarks: usability as the key to increasing business profit
Low lead conversion, high churn rates, and loss of users during onboarding are just some of the challenges faced by B2B SaaS companies. These problems are often caused by poor interface usability rather than product features or quality.
In this article, we will examine B2B SaaS conversion benchmarks, analyze the challenges most commonly faced by SaaS product owners, and provide practical UX/UI tips to help you convert website visitors into loyal customers.
Key B2B SaaS funnel metric conversion rate: stages, challenges, and solutions
To optimize the B2B SaaS sales funnel, you need to identify areas for improvement and understand the key conversion metrics at each stage of the customer journey. Unlike e-commerce, where success is typically measured by the number of purchases made, SaaS products involve a wider range of performance indicators.
Therefore, if we consider the B2S SaaS funnel metric conversion rate through the AARRR framework (‘Pirate Metrics’), the sales funnel can be divided into five main stages:
- Acquisition;
- Activation;
- Retention;
- Referral;
- Revenue.
Together, they encompass the entire cycle of user interaction with a SaaS product — from the first touch to signing up for a paid subscription. The effectiveness of these steps largely depends on the quality of UX/UI design. How exactly? Let's take a look at the examples below.
Stage 1. Acquisition: first interaction and familiarization with the company
Over 55% of users spend less than 15 seconds on a SaaS website, meaning you don’t have much time to impress potential clients. And poor interface design can result in losing potential customers who decide not to subscribe or take the target action.
A potential customer uses the website interface to get acquainted with your product and its features. The user studies the product's characteristics, benefits, and cost-benefit ratio to make a decision: leave or stay.
Key metrics to track:
- Page view depth;
- Average session duration;
- Number of pages per session.
Challenges: Users visit the website, navigate through various pages, and even interact with content, but do not sign up or create accounts.
Possible reasons:
- Users do not understand the benefits your services/products offer;
- The information is poorly structured and difficult to find or read;
- The registration/application form is too complicated and unclear.
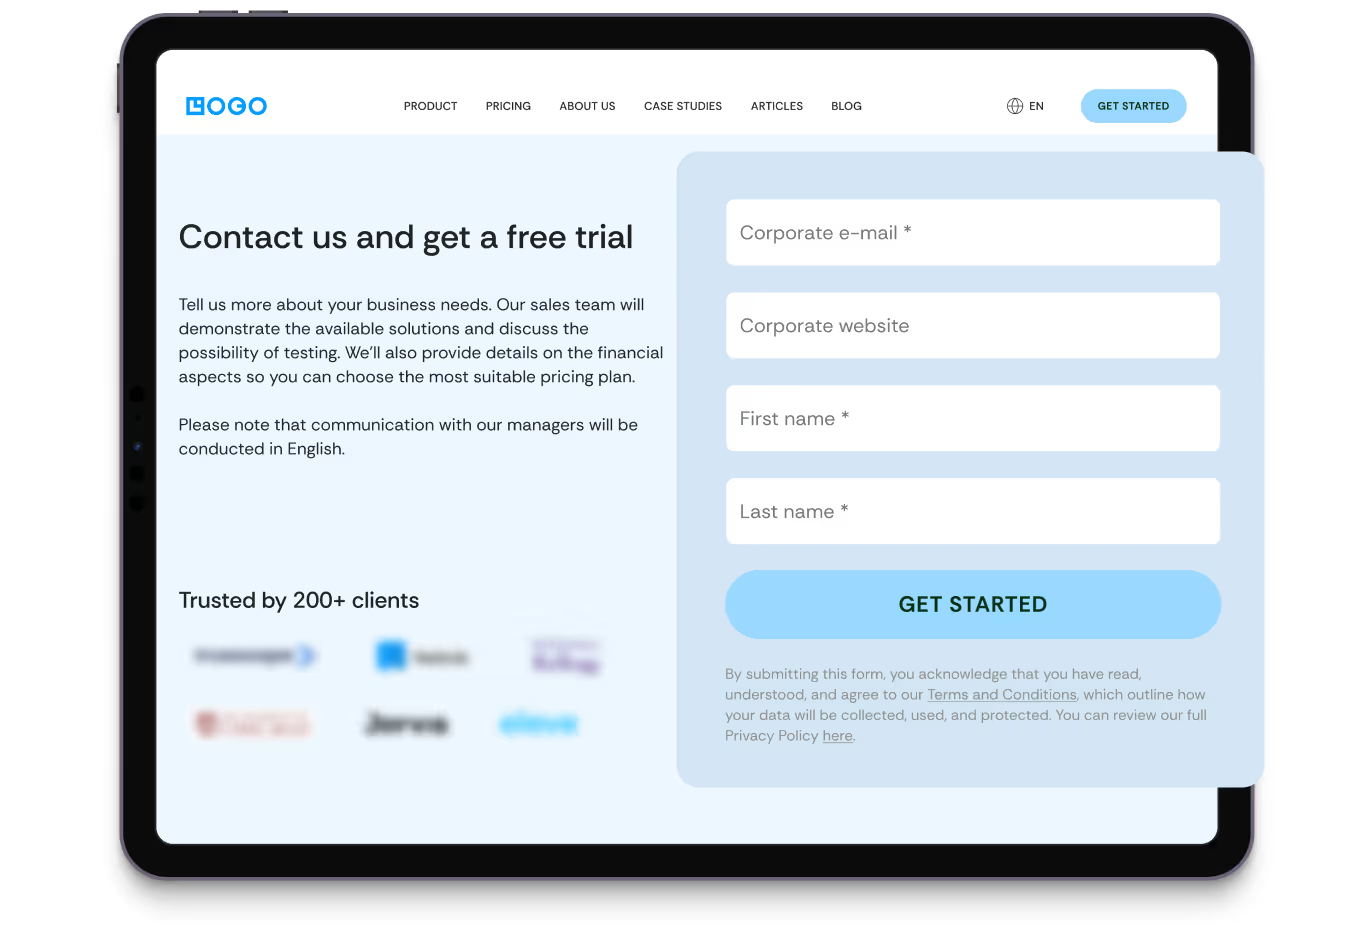
Solution: Optimize customer journey and landing page structure, and develop a simplified registration form — by reducing the number of fields to 4, you can increase website conversion by 120% and more.
Thus, even small interface changes can lead to SaaS B2B conversion rate optimization by 75%. In one case, we discovered that users didn’t realize there was a second step in the application process — booking a call with a manager. Because of this, only 20–30% of users actually completed the call
We redesigned the application form by adding the elements displaying and naming further steps. This simple improvement increased the number of booked calls by 75%.

Stage 2. Activation: converting website visitors into SaaS users
The user has already created an account and proceeds to the next step — onboarding.
Key metrics to track:
- Activation rate;
- Time to value (TTV);
- Onboarding completion rate.
Challenge: The user doesn't finish onboarding and stops interacting with the product and/or website.
Possible reasons: long, complicated, or confusing onboarding process; users find it difficult to navigate the product, service, or documentation.
Solution: Optimize the UX of the onboarding section. There are many options available today, from video tutorials to AI chatbots, to simplify this process for users.
Remember that even simple and minor changes, such as adding guides, can greatly facilitate the onboarding process and help your users get through this stage.
For example, when RPC Fast users signed up for the first time, they were confused and couldn't quickly find information about the product and how to use it. So, we recommended adding articles with guides to the dashboard as the quickest and easiest solution, which had a positive impact on SaaS conversion rates.

Stage 3. Retention: establishing lasting relations with SaaS users
Once onboarding is complete, your next challenge is to retain customers. Retention is a key metric — gaining new users costs more, but keeping existing ones isn’t easy either.
Since there are many SaaS business models, let's consider a SaaS product with a free version, which the customer uses regularly, developing a certain level of loyalty — or not ;).
Key metrics to track:
- Number of active users;
- Utilization rate of key product features;
- Churn rate (it must be less than 1-2% per month for B2B SaaS otherwise, we are dealing with much deeper problems than just poor usability);
- Customer retention rate.
Challenge: After onboarding, users lose interest and don't even use the product’s free version.
Possible reasons: The product doesn't meet users’ requirements, too many restrictions in the trial version or lack of information about SaaS functionality upgrade upon subscription.
Solution: Study analytics to find weak points, add pop-ups or banners reminding about the option to upgrade to a premium subscription, and include clear, visually accented calls to action (CTAs).
Heat maps and session recordings can help you identify issues users experience on their path to purchasing. For example, when reviewing the heat map of the RPC Fast dashboard, we saw that users actively engaged with the key feature but didn’t fully understand how the number of elements available per month was calculated. That might have discouraged them from upgrading to the paid version.

We optimized the dashboard interface: added an element displaying the number of items used per month, a graph showing spending trends, information about the current plan, and payment statuses. This data transparency makes it easier for users to decide whether to switch to a paid subscription.

Stage 4. Recommendation: encouraging client to give feedback
The customers are satisfied with your product and regularly use it. But are they willing to leave a positive review, share their experience on social media, or recommend your SaaS to others?
Key metrics to track:
- K-factor;
- Percentage of customers who came to the product via a referral link;
- Net Promoter Score (NPS).
Challenge: Despite their loyalty, users do not leave reviews or recommend your SaaS product to others.
Possible reasons: No way to quickly share a link to SaaS, lack of motivation/reward.
Solution: Add buttons such as “Share my progress” and “Share with friends” to the interface, offer bonuses for reviews or each referred customer, and create a community spirit via customized UI elements.

Stage 5. Profit: bringing the clients to the target action
The last and one of the key stages of the funnel, which determines the profitability and success of a business, is the transition from a trial version to a paid subscription/product purchase.
Key metrics to track:
- ARPU/ARPPU;
- AOV;
- LTV:
- ROI.
Challenge: Long sales cycle in SaaS B2B.
Possible reasons: Unclear terms and benefits of upgrading to a paid version, lack of social proof (reviews, case studies), or lack of motivation.
Solution: Optimize the UX of the pricing and payment pages, add social proof blocks and an ROI calculator (if relevant to your business), and highlight the benefits of switching to a paid product.

When we redesigned the dashboard and payment pages for one of the projects, we came up with the following hypothesis. Users didn't buy a subscription or take advantage of the bonus system because they didn't realize that they would get a $50 bonus for upgrading their plan.
For our client, we increased the B2B SaaS conversion rate to the paid version by 35% simply by changing the button name from “Upgrade” to “Upgrade for a $50 bonus” and visually highlighting the benefits of the upgraded plan.


Top 5 factors affecting the B2B SaaS average conversion rate
After exploring key stages of the SaaS sales funnel, you may be wondering, “How do I know if my product needs UX/UI optimization?”
Here are a few factors that influence B2B SaaS conversion rate benchmarks and should be taken into account:
1. Niche specificity: Statistics show the following trend: the more complex the product, the lower the average B2B SaaS conversion rate. This trend can be explained by long sales cycle and the need for users to spend more time and effort getting to know the platform's services.
To give you an idea, the average user engagement rate for AI&ML is almost 50% higher than in the FinTech and insurance sectors.

2. Company size: The average conversion rate B2B SaaS for small and medium-sized businesses is higher than that of large companies. For example, the average conversion rate from lead to deal closure for the first category is 39%, while for the second one — 31%. This may be due to more flexible decision-making processes within smaller companies.
3. Marketing channel: The way you attract new customers directly affects your SaaS conversion. Thus, SEO tools and content marketing are much more effective than paid advertising (PPC): 2.1% and 0.7%, respectively.

The reason is simple: users who come from organic search are usually more interested in buying something and don't need to be warmed up.
4. Credit card requirements: Here's an interesting and pretty obvious thing: when you ask people to give their credit card info right off the bat, you freak them out. According to a study by Slideshare, removing the requirement to enter credit card details increased the website's conversion rate by 8%. And conversions from the trial version to a paid subscription increased by 35%.

5. User experience (UX/UI): low subscription and high bounce rates, poor engagement levels, etc., are some of the most common problems faced by SaaS businesses. Our experience and analytics show that in most cases, these problems are caused by interface issues.
Optimizing SaaS B2B conversion rates: final thoughts
According to Forrester study, every $1 invested in UX design brings $100 in revenue (ROI = 9,900%).
Here are some key UX/UI tips for improving customer experience of your SaaS product that are worth paying attention to:
- Registration: don't ask users to register on your website once they open it — give them time to explore your product. Preferably, place registration forms at the bottom of the home page: let users learn the benefits and features of your services first and only then decide whether to sign up and explore the available pricing plans.
- Onboarding: add tips, instructions, and video guides to explain users how your service works. Otherwise, they might get lost and frustrated, and you'll lose them pretty fast.
- Analytics and dashboards: tables, graphs, and charts can significantly improve the customer experience of your SaaS product. We also recommend ensuring that your dashboard is adaptable and flexible — if users can customize data tables to suit their needs, their loyalty to the product will increase, thereby leading to SaaS B2B conversion rate optimization
Why is all of this so important for SaaS products? It’s because the goal of such websites is not a sprint, but a marathon. And by ensuring high-quality UX design, you will increase user loyalty, which in turn will boost B2B SaaS conversion rates and ensure stable profit for your business.
FAQ
Question reference
Answer reference


.png)


.png)
More real-world Turum-burum cases?
Review our vast portfolio of cases in a variety of business fields to make sure of our expertise.
Go to Portfolio
